- Customer Care
- General
- Statistical Calculations
-
James Heal
-
Hardware
-
Software
-
Firmware
-
Instruments
- Wrinkle Recovery Tester
- Wascator
- ProMace
- Titan 4, 5 and 10
- GyroWash
- FlexiFrame
- DynaWash
- TruBurst
- Orbitor
- Spray Rating Tester
- CrockMaster
- FlexiBurn
- Apollo
- SnagPod
- ThermaPlate
- TruFade
- AccuDry
- Martindale
- ElmaTear
- ElastAbrasion
- ProView
- Sample Cutters
- Titan
- Colour Assessment Cabinets
- Perspirometer
- Impulse
- Titan 1 2 3
- Crease Recovery Angle Tester
- DynaWash & DynaWash Duo
-
Operator's Guides
- GyroWash
- ElastAbrasion
- ProView
- Martindale 1300 Series
- Martindale 900 Series
- TruBurst
- FlexiBurn
- Orbitor
- HydroView - Hydrostatic Pressure Tester
- CrockMaster
- Wascator
- DynaWash & DynaWash Duo
- AquAbrasion 1819
- ThermaPlate
- Impulse
- Sock Abrasion Kit
- AccuDry
- Memmert Incubator IN30
- Spray Rating Tester
- Martindale 1600 Series
- AirPro - Air Permeability Tester
- TruFade
- Sample Cutters
- Titan
- General
- Tautex
- Perspirometer
- ElmaTear
- Martindale model 103
- Crease Recovery Angle Tester
- FlexiFrame
- ProDry
- Yellowing Test Kit
- Incubator / Oven
- Wrinkle Recovery Tester
- TruRain
- ProMace
- WickView
- SnagPod
- INSTALLATION GUIDE
- Drape Tester
-
Test Materials
-
EU Declaration of Conformity
-
Material Safety Data Sheets
-
General
-
Uncategorized
-
Filters
What is the Coefficient of Variation?
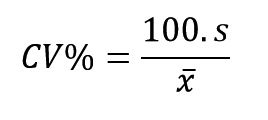
A coefficient of variation (CV, CV, or sometimes V) can be calculated from the standard formulation of the CV, the ratio of the standard deviation to the mean, and is usually expressed as a percentage in textile test results.
The coefficient of variation is also known as relative standard deviation (RSD).

The coefficient of variation is useful as it is dimensionless, i.e., independent of the unit in which the measurement was taken.
It shows the extent of variability (dispersion) in relation to the mean of the test results.
The CV or RSD is widely used in analytical work to express the precision and repeatability of a set of test results.
The smaller the CV, the more concentrated the data values are about their mean; conversely, a large CV implies that the data values are more widely dispersed about their mean value.
The lower limit of a CV is zero, but there is no upper limit.
It is important to remember that the CV is a measure of relative variability and that it has an inverse relationship with the sample mean.
Large coefficients of variation (>30%) are often associated with increased experimental variability.
